Navigating the Data
There are some tips and tricks for navigating your data. Here are some of the most common methods.
Zooming / Panning
Panning Left and Right
Left mouse click and drag the waveform area to the left or right.
Zooming In and Out
Mouse wheel up or press Number Pad + to zoom in. Mouse wheel down or press Number Pad - to zoom out.
Quick calculation
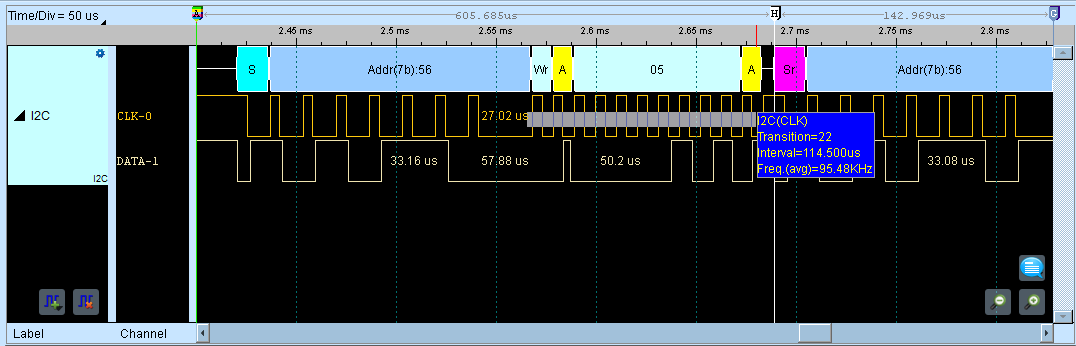
Right-click and drag to select a region. This gives you:
- Number of signal transitions in the selected interval
- Length of time (duration)
- Average frequency
For example, the figure below shows an immediate estimate of the I2C clock frequency at about 95 kHz.
Quick note and marker annotations
Add notes and visual markers directly in the waveform area to document important signals or conditions.
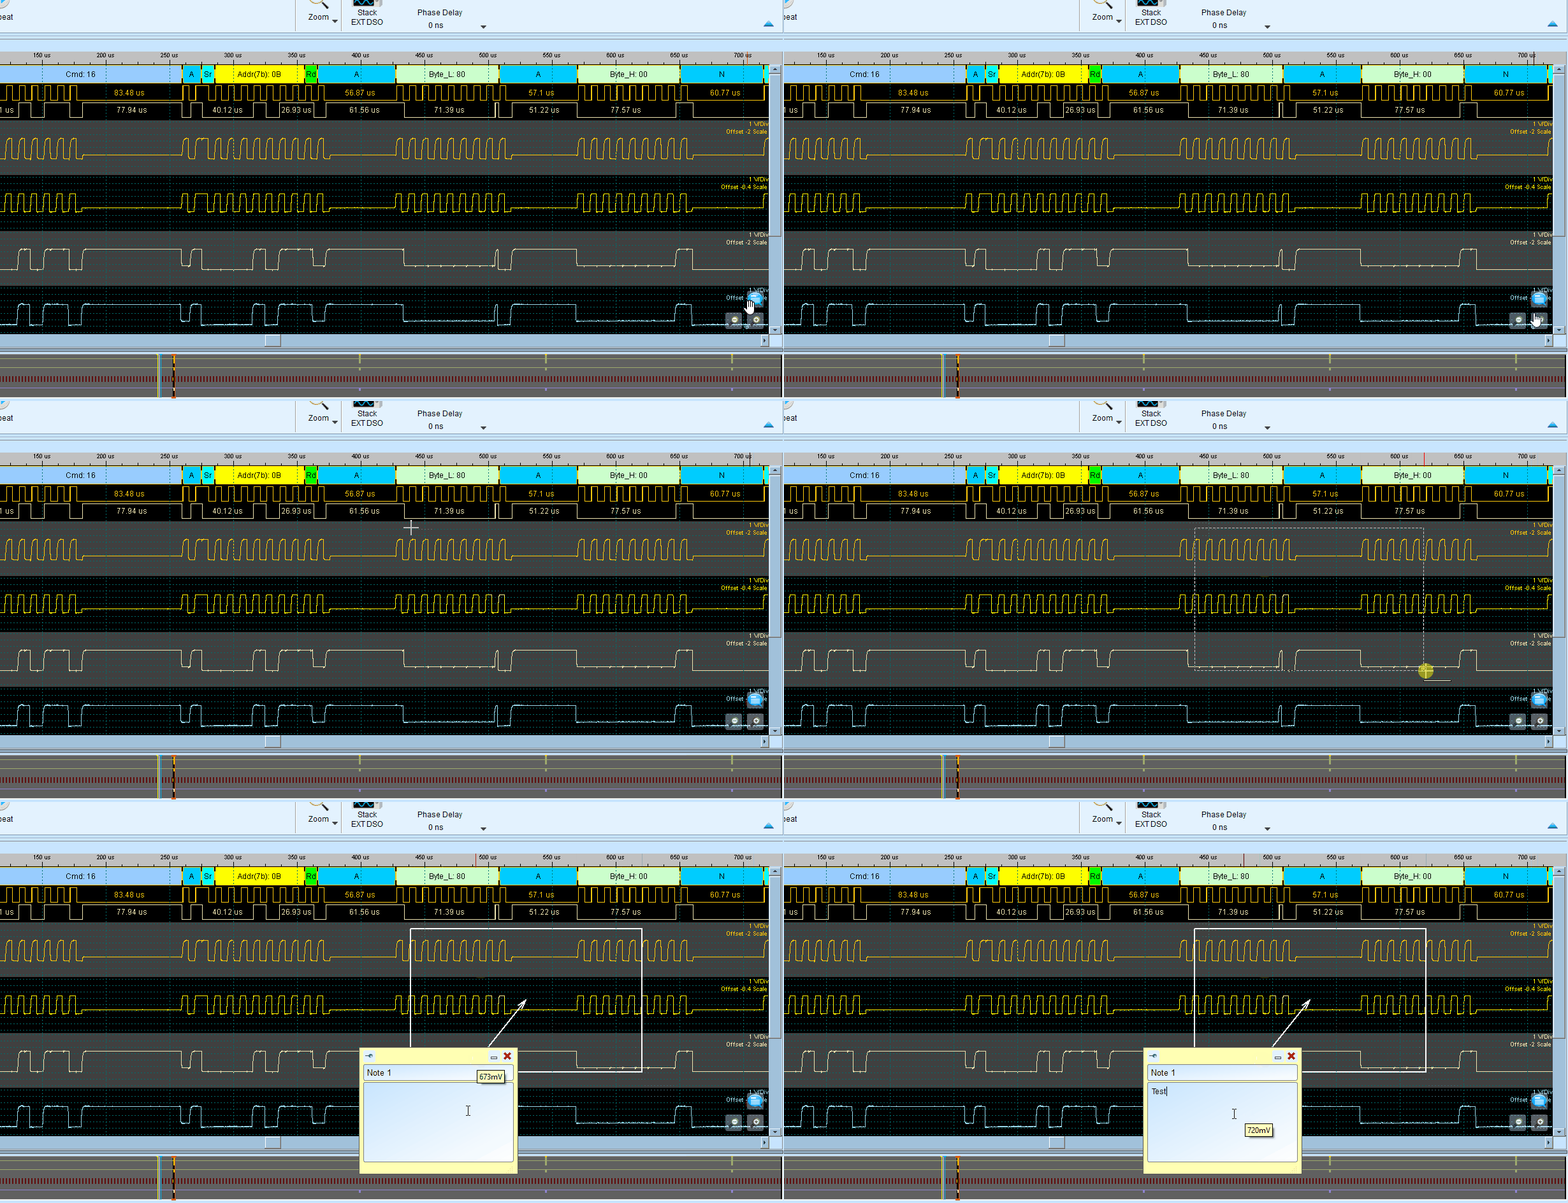
This gives you the ability to quickly add text labels, graphic markers, and notes at specific time positions. It makes it more convenient to document your findings anywhere in the waveform area.
Vertical adjustments
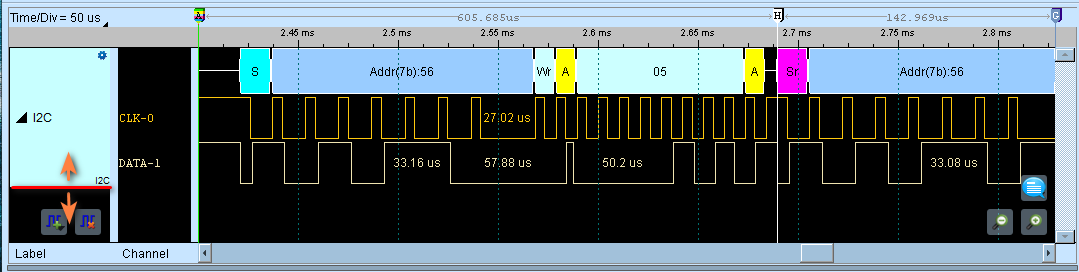
You can adjust the channel labels by dragging the label border.
You can also change the order of the channel labels.
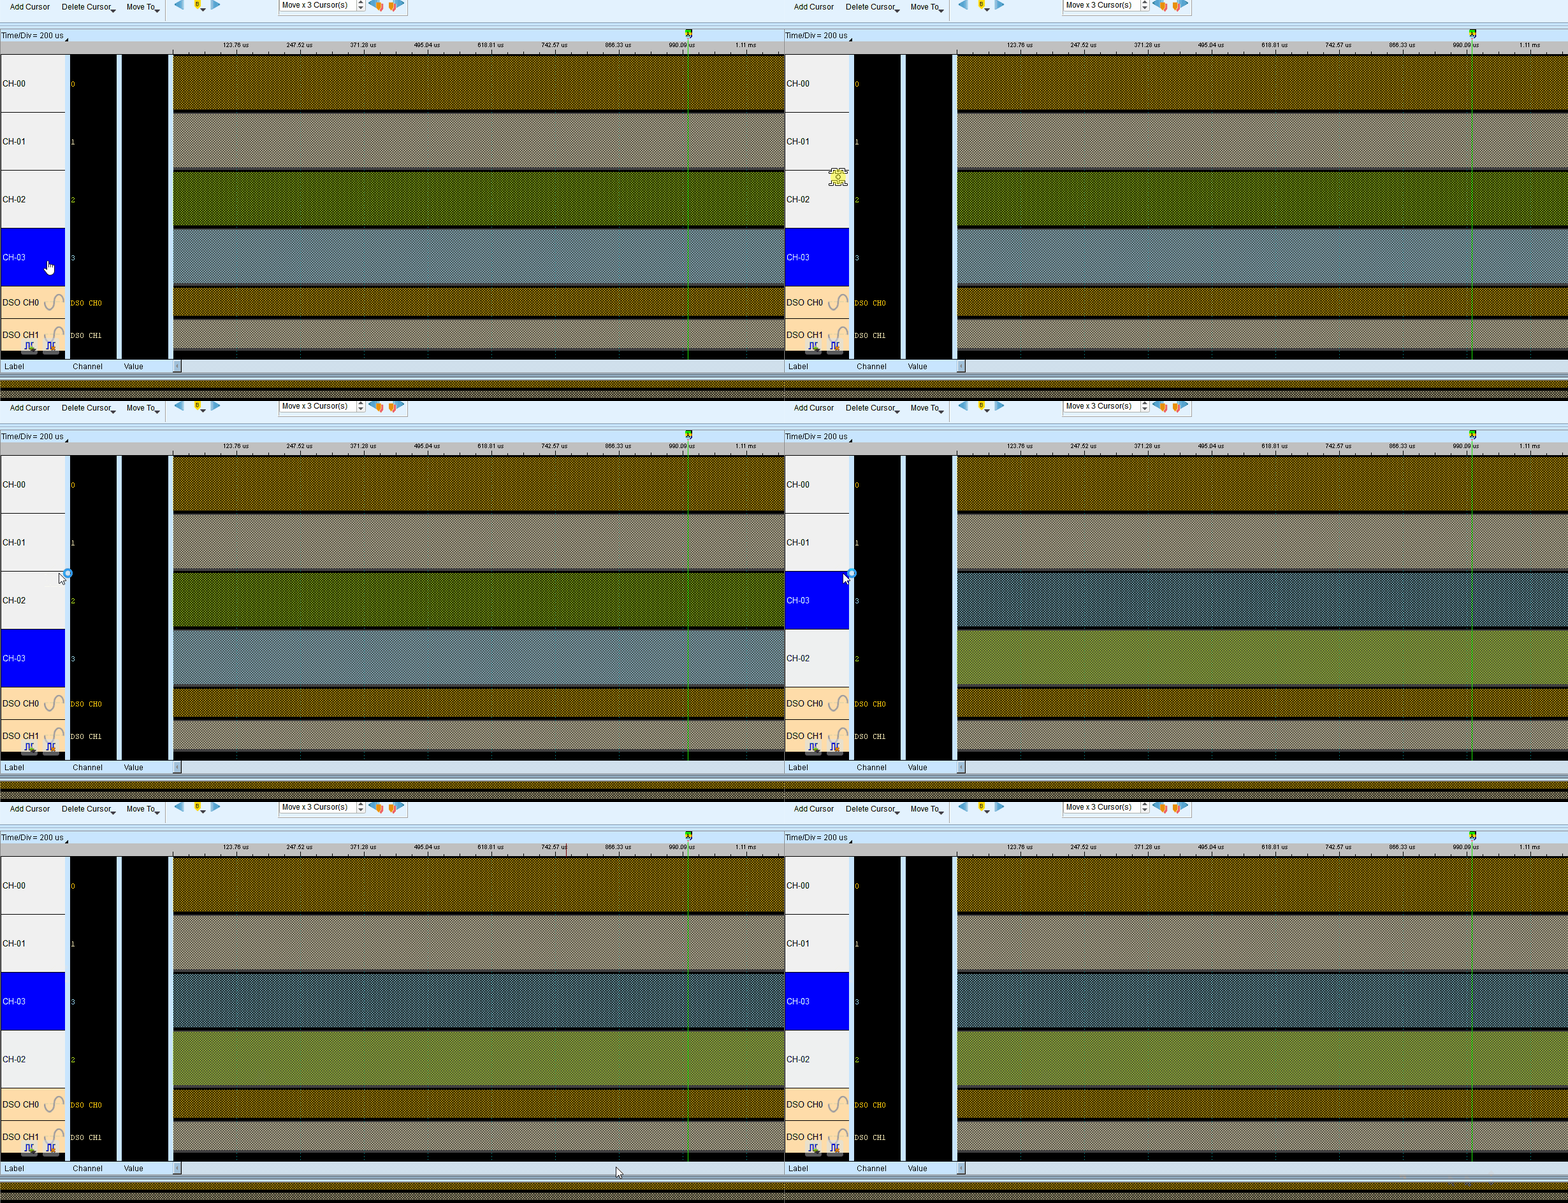
For more on managing the channel labels, see the Channel Labels section.
Display Optimization
Hide the toolbar by clicking the arrow up icon.

To maximize the waveform area, you can drag the divider between the waveform area and the report area to the bottom.
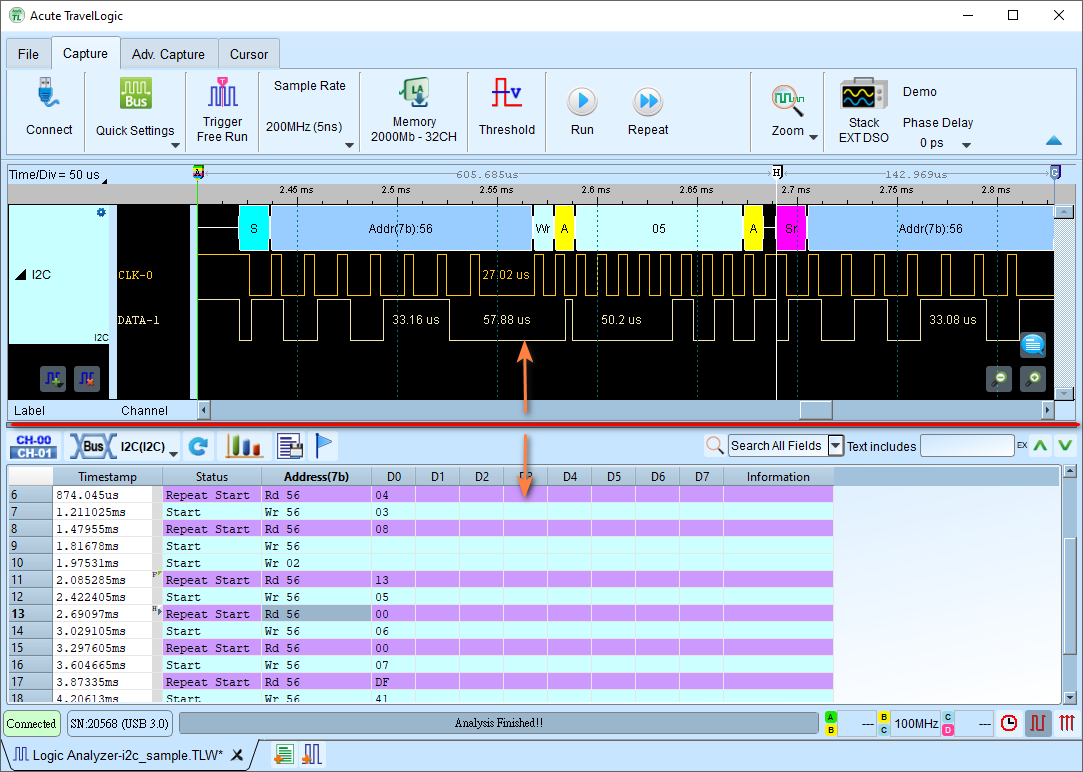
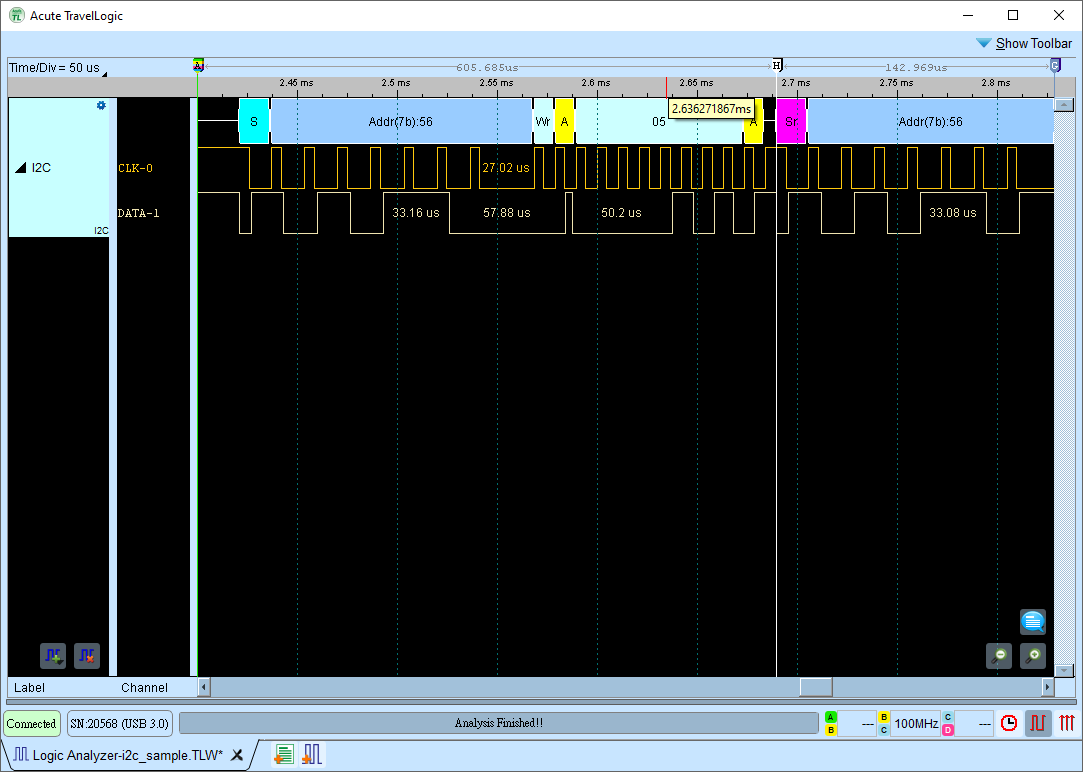
Fast navigation via Cursors
You can use cursors to quickly navigate to specific positions in the waveform area.
Consider the following example. Suppose Cursor H is outside the viewing area and we want to jump to it.
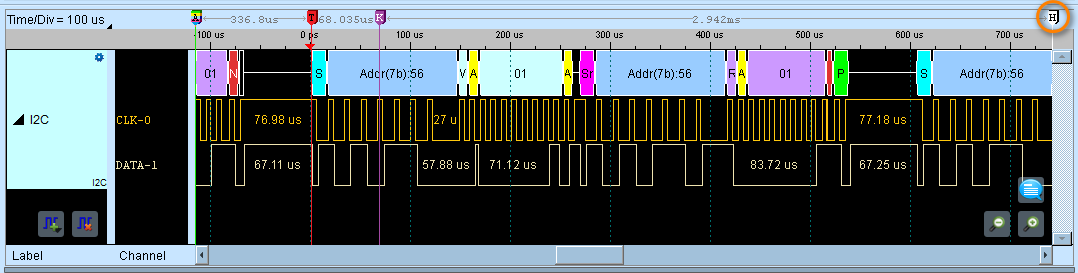
Press the H key to jump to Cursor H. It now sits in the middle of the waveform area.
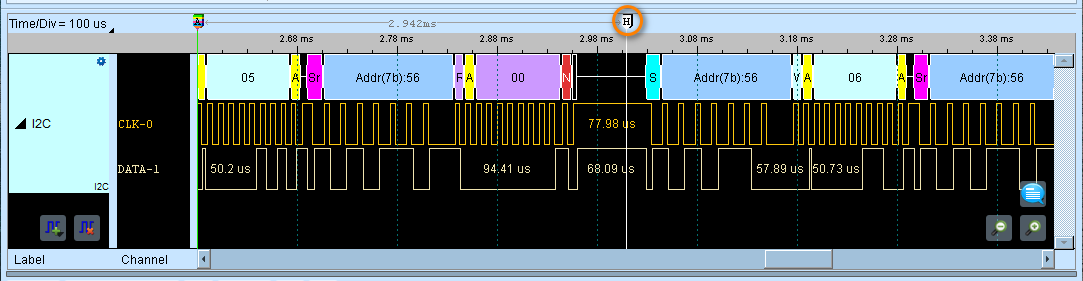
Cursors work like bookmarks. Drop them anywhere you want to return to later, and you can move around the waveform area quickly. Add a cursor by pressing Shift + A-Z.
See also Cursor operations for more details.