Interact with cursors
Cursors help you navigate and analyze the captured data. You can use them to jump to specific positions in the waveform area, to make precise time interval and frequency measurements, and to run detailed waveform searches.
Overview

Cursors can be added, deleted, and dragged to any positions in the waveform area.
Special-purpose cursors
T cursor: Marks the trigger point (most likely to be at a fixed position). This is typically red-colored.
Operations
Add cursor
This will automatically add a cursor right after the last cursor (incrementing the letter from A to Z).
Tip
Keyboard Shortcut: Press Shift + A-Z keys to add a cursor at the mouse position.
Delete cursor
A dropdown list pops up with the existing cursors you can delete, or you can remove them all at once with the Delete All button.
Move To
Quickly jump to specific positions in the waveform area.
Shortcut: Press A-Z keys to quickly jump to the corresponding cursor location.
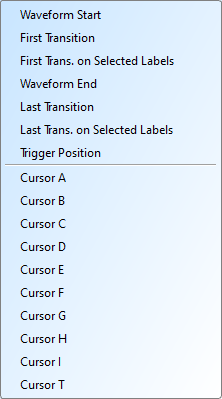
Available positions:
- Waveform start: Move to the beginning of the captured waveform
- First transition: Move to the first waveform transition on any channel
- First transition on selected label: Move to the first transition of a specific channel label
- Waveform end: Move to the end of the captured waveform
- Last transition: Move to the last waveform transition on any channel
- Last transition on selected label: Move to the last transition of a specific channel label
- Trigger position: Move to the trigger point (a.k.a. T cursor)
-
Cursor A-Z: Move to any named cursor position
Tip
Keyboard Shortcut: Press A-Z keys to quickly jump to the corresponding cursor location.
Waveform Search by Cursors
Find specific signal patterns using four search modes.
1. By Edge
Move the specified cursor position according to the number of Rising / Falling / Either edges (x1 ~ x4096) of the specified channel.
2. By Time
Move the specified cursor position forward or backward to specify the amount of time.
3. By Value Match
Searches the displayed values on the specified channel. If the channel is a protocol decoder, the search uses a text comparison. If it is a bus or a plain channel, the search uses a numerical comparison.
4. Search Pulse Width
Searches the specified channels for pulse widths that meet the condition. Use the single-cursor movement on the left or the multiple-cursor movement on the right for any match that meets or exceeds the condition.
Measuring with cursors
At the bottom right of the UI, a measurement display bar shows measurement values between cursors. It updates automatically when you move the cursors. You can also set the cursor pairs manually by clicking the A-Z buttons.
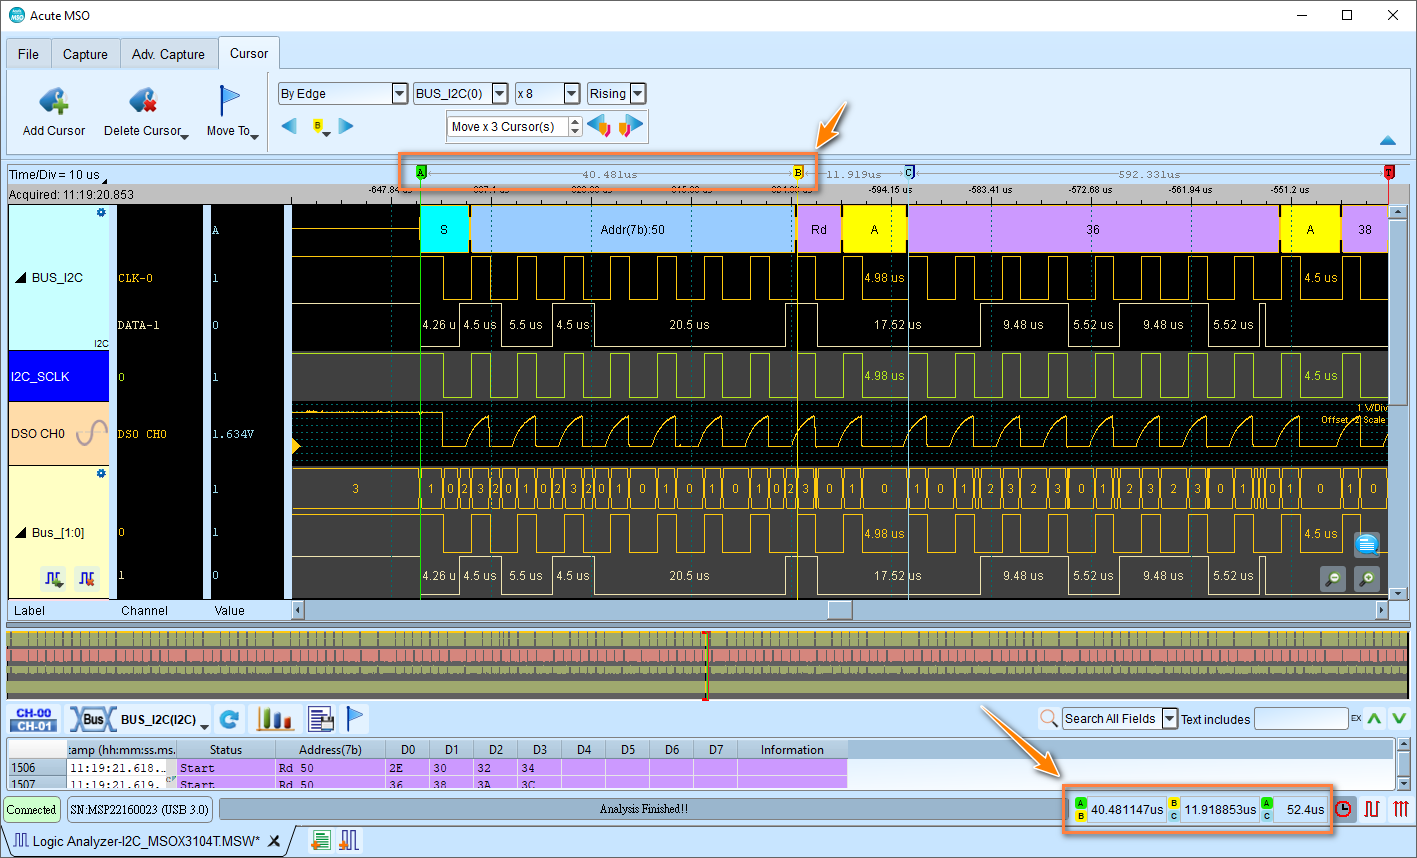
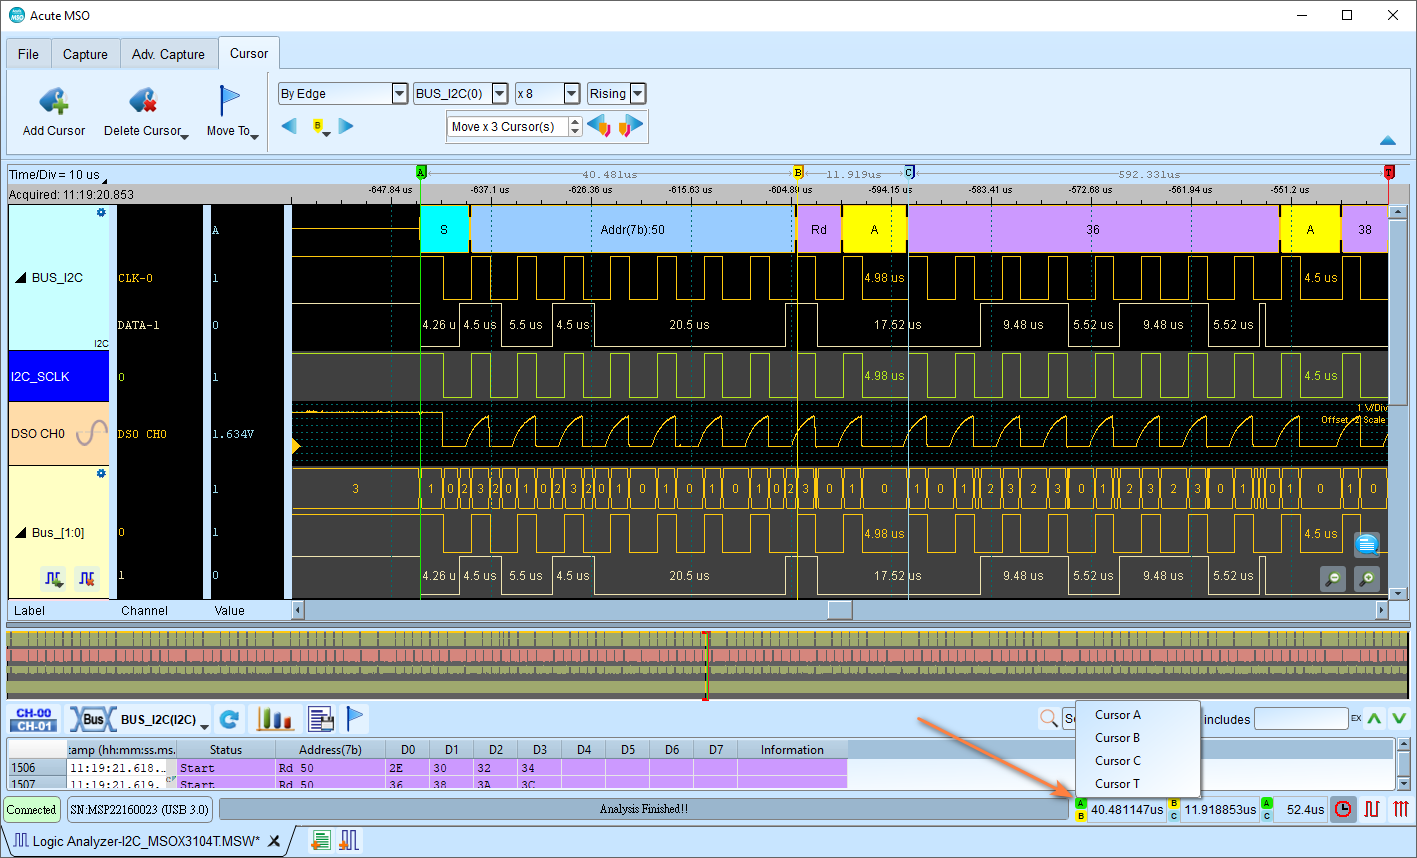
You can also change the display format of the measurement with the icon on the right side of the measurement display bar.
 Sampling statistics: Number of samples between cursors, depending on the sampling rate of the captured data.
 Frequency calculation: Frequency = 1 / interval time
- Sampling statistics: Number of samples between cursors, depending on the sampling rate of the captured data.
Multiple measurements
You can configure the maximum number of cursor measurement groups (3-10) in system environment settings. Default is 3.